The gross domestic product (GDP) measures how much goods and services have been produced in a year. It measures the economic activity of a country and is used as a a proxy to track the standard of living. The higher the GDP per capita, the more goods and services are accessible to the population, the higher is the living standard.
The very good post “What is economic growth?” from ourworldindata.org makes GDP more tangible:
Have a look around yourself right now. Many of the things you see are products that were produced by someone so that you can use them: the trousers you are wearing, the device you are reading this on, the electricity that powers it, the furniture around you, the toilet that is nearby, the sewage system it is connected to, the bus or car or bicycle you took to get where you are, the food you had this morning, the medications you will receive when you get sick, every window in your home, every shirt in your wardrobe, and every book on your shelf.
Over time, the cost of good and service decrease, due to improvement in production. The utility of the good or service remains constant, though. Inversely, for a given price, the utility increases. An affordable car today is way more comfortable, secure, and efficient than a car from ten year ago for the same price. GDP and progress don’t correlate exactly then. A constant GDP could still represent a constant, modest progress. But in practices, progress is manifested by increased GDP per capita.
Using GDP as proxy for standard of living is subject to debates. Besides access to goods and services, standard of living also encompasses dimensions like access to education, access to nature, or access to health care. Different countries and social systems with similar GDP may fare differently on these points. As a crude measure for the whole country or per capita, GDP says little about the distribution. Inequality isn’t well captured by GDP.
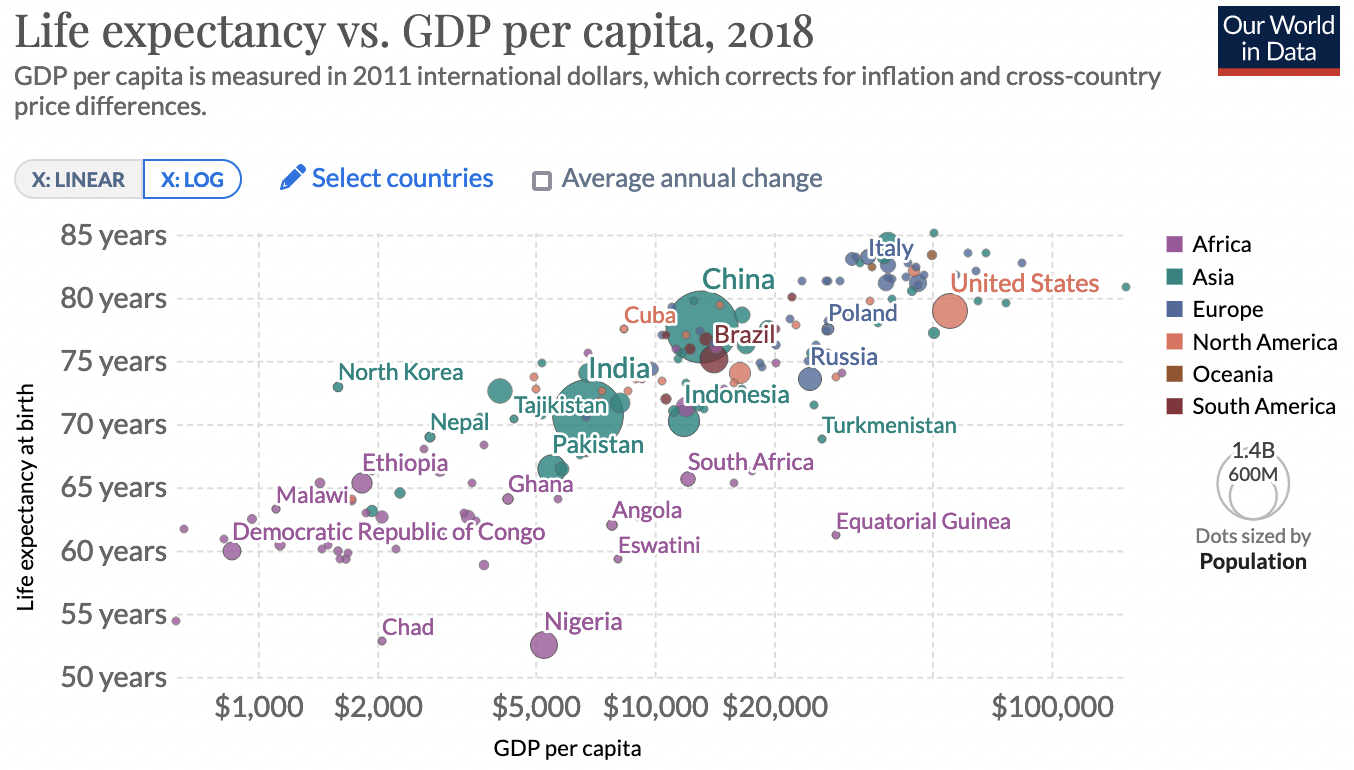
The cousin of GDP to track standard of living is life expectancy. Life expectancy also aggregates and proxies several aspects like education, access to health care, or overall well-being. Interestingly, while both metrics usually correlate, there are discrepancies that remind us that the metrics or only proxies and have flaws.
Ourworldindata.org has an interactive chart to explore GDP and life expectancy:
The GDP is influenced by the household structures. Depending on how GDP is computed, it may or may not contain “services” provided by family members, such as cooking, child care, or taking care of the elderly.
On one hand, it makes sense to include personal activities in the GDP. If you grow your vegetable yourself, you’re working as a farmer with one consumer, yourself. You’re producing some good for yourself. One the other hand, it’s not economic activity – it’s not traded on a market. This activity is not on the market and will not “benefit” from market mechanisms (or rather be “driven” by market forces), such as market-driven specialisation, allocation of resources, or pricing.
In economic logic, growing yourself your vegetable isn’t rational, since you use time that you could have invested in some other more rewarding economic activity, depending on your profession. The same holds for child care: working part-time to raise children isn’t economically rational if you have a high-paying profession.
The reason people are willing to sacrifice profit for such activities at the moment is leisure and fulfillment. They find an increased happiness at some other level in these activities.
Leisure and fulfillment work at the personal level. Doing more outside of the formal economy also brings benefits to the economy itself: it increases resilience and sustainability. These values are not accounted in classic economy, but maybe should.
Given the flaws of GDP, it’s no surprise that other metrics have been developed to track development, for instance the human development index. But the simplicity of GDP (or life expectancy for that matter) is very attractive. GDP will remain the prevalent metric for the years to come.
